
Every Event In Context, Any Question In Seconds
Ask anything across your raw event data and get a grounded report, chart, or analysis the moment you ask, no data prep, or ETL required. Available through Web, Slack, SQL, BI tools, APIs, and MCP.




Built on the Full Sequence and Not a Snapshot
Traditional analytics answers from dashboards, aggregates, and prepared views. Keewano keeps every entity's events in order and directly readable, so new questions need no new pipeline.
The sequence is a read, not a reconstruction.
Below: a real investigation: bot-inflated revenue found, stripped, and re-trended in a single conversation.




IAP / DAU is flat (~$0.195) across both fortnights — the revenue drop is pure traffic loss, not weaker monetization.
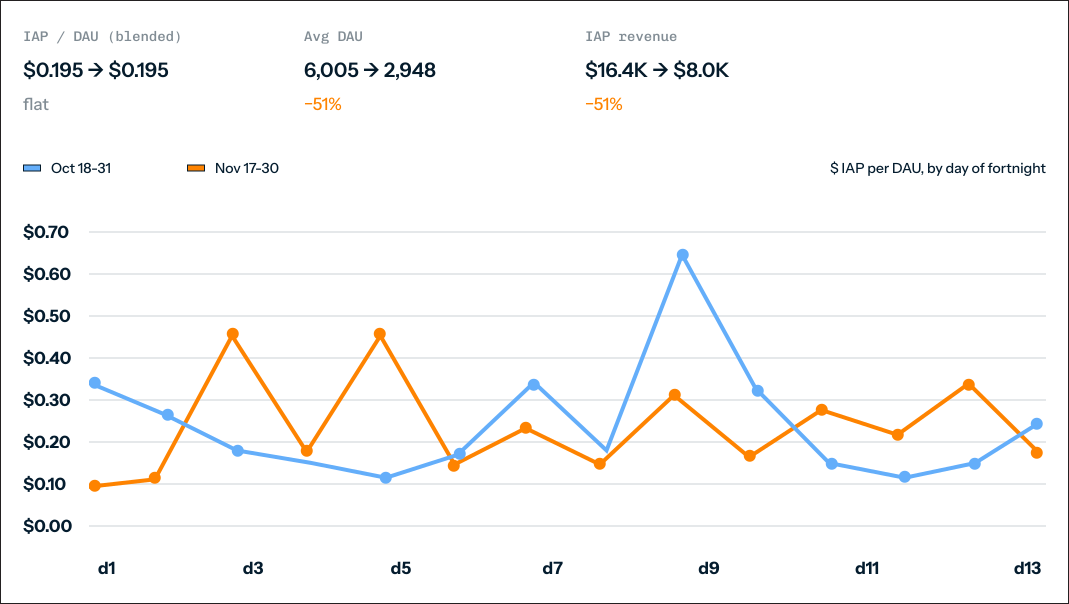
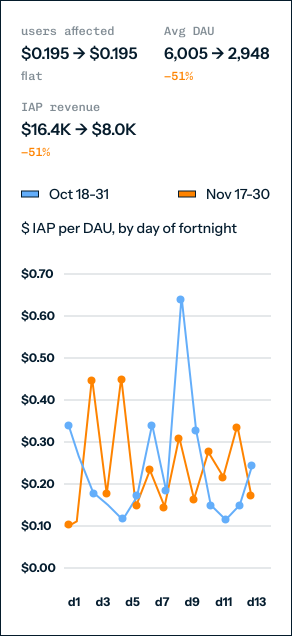
Takeaway: IAP/DAU flat (~$0.195) both fortnights; DAU and IAP each ~51%. Revenue fell because traffic halved, not because paying got worse. (Spikes = bots; blended ratio otherwise stable.)
One bot. The Oct-26 spike is a single account — 88717fc3... (the #1 quarantine bot / Russian $10,325 whale): $3,615 in 243 purchases that day = 89% of the day's revenue. Next-highest was $52. Remove it and d9's ratio drops $0.656 → $0.074, right in line with its neighbors. Not an event — a bot burst.
Oct 26 — where the $4,073 came from
DAU 6,206 · ratio 0.656 (day 9 spike)

Verdict: d9 spike = 1 bot (88717fc3..., $3,615 / 243 buys). Cleaned ratio $0.074 — no real event.
The fortnight chart re-rendered bot-free for the site?
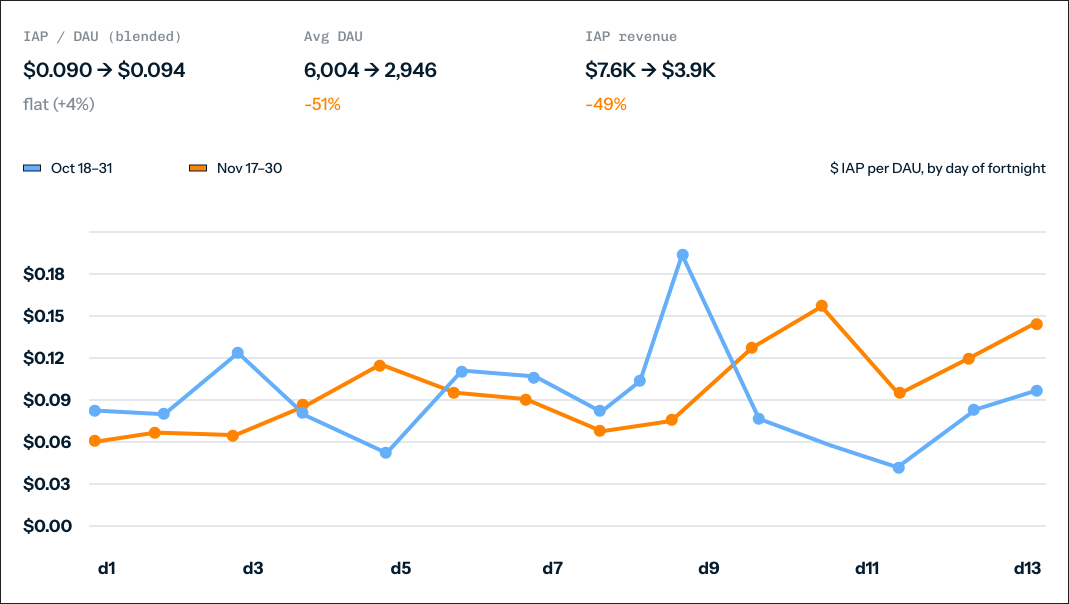
Bot-free (all 28 flagged accounts removed). Real IAP/DAU ≈ $0.09 both fortnights — flat, and half the bot-inflated $0.195. d9 spike gone.
✓ 28 flagged bots removed

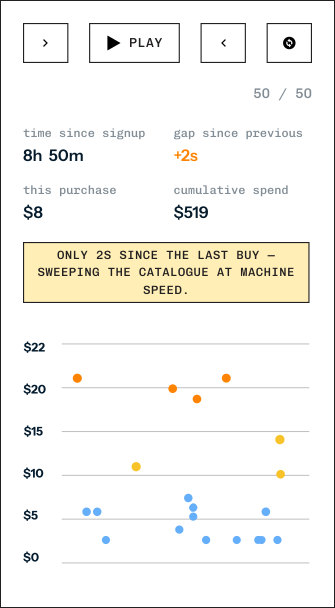
Fraud skill — cadence across the 4 biggest bots. Every panel shows the same machine signature: tight vertical stacks of identical prices, seconds apart (orange = <10s gap). No human buys like this.
Each dot = a purchase (x = order, y = price) · orange = <10s since previous · first 40 buys
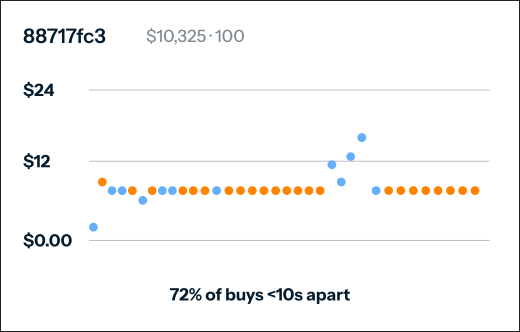
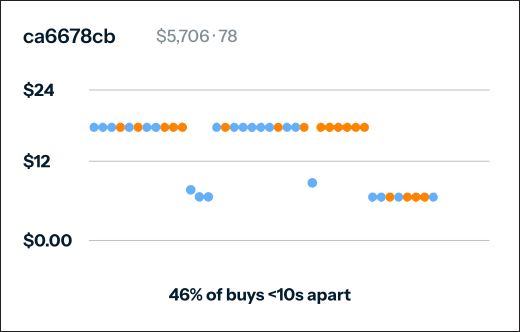
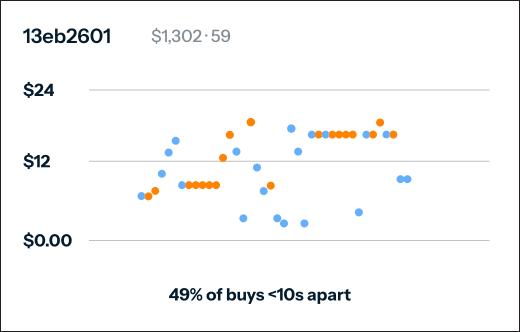

Takeaway: All 4 confirm the same pattern. Flat horizontal stacks (same price repeated) + heavy red (<10s gaps), fraud scores 59–100. Machine cadence, not human.

Warehouse Questions Without the Warehouse Work
Raw, complete, ordered events are ready to query as they arrive. Build reports and compare behavior without waiting on ETL or remodeling the data. The same question can keep running as new events come in.
Millisecond Queries Across
Billions of Events
Built on KeewanoDB, Keewano Analytics queries billions of raw events in milliseconds without aggregation tables or new pipelines. Build dashboards or connect agents through MCP directly to the complete contextual event record.
The Full Event Record Stays Available
Every event remains tied to the customer, account, transaction, device, or system that produced it, so every analysis stays grounded in what actually happened.
Meaning Is Added Automatically
Keewano maps raw events to business concepts, metrics, definitions, and outcomes.
Analysis Runs In Database
Reports, similarity, comparisons, and cause-and-effect analysis run close to the event record.
One Event Record Across Every Keewano Experience
Web, Slack, agents, SQL, and BI tools all work from the same underlying event record and shared definitions.

Keewano MCP for Agents
Give agents direct access to Keewano.

Keewano Ask for Slack
Ask questions like your teammate.

Keewano Signal
Tracks the metrics with the biggest impact on your product.

Keewano Ask for Web
Ask questions, create any report.

Query Studio, SQL
Write SQL queries, build custom dashboards.

Integration with BI
Connect Tableau and Looker.
Real-Time Analytics Without the Preparation
Reports and Visualizations
Create pivots, funnels, retention, progression, engagement, revenue, economy, KPI, and custom reports.
Cause-and-Effect Analysis
Identify which events, conditions, and changes contributed to an outcome, with every result connected to the underlying events for easier verification and trust.
Open-Ended Analysis
Ask new questions without preparing another dashboard, model, or pipeline first.
Behavioral Similarity
Start with one customer, account, transaction, device, or run and find others that followed a similar pattern.
Questions That Depend on What Happened Over Time
When a question depends on event order, Keewano reads the complete record directly and compares it across the full population.
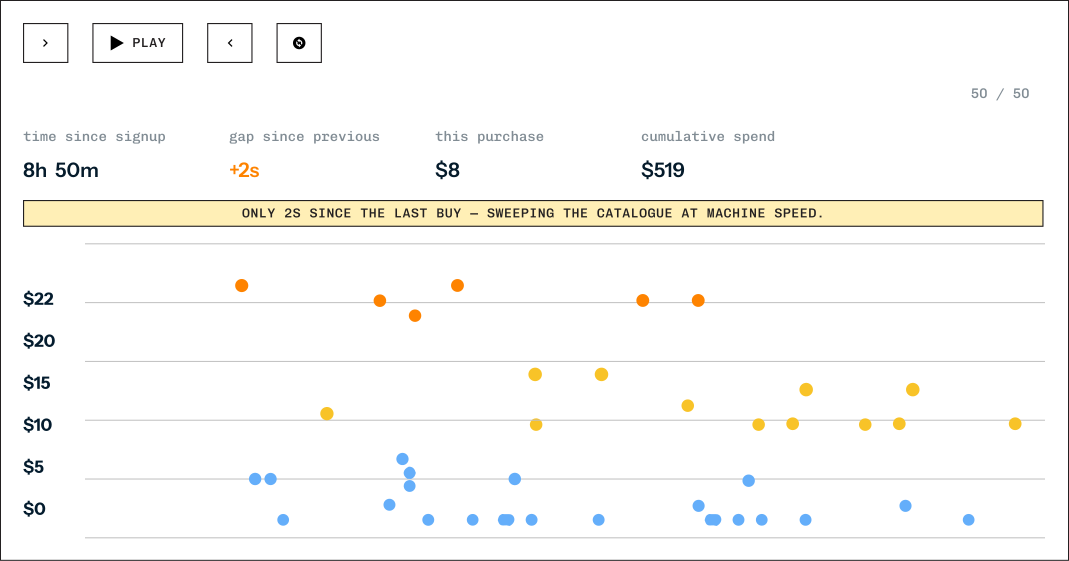
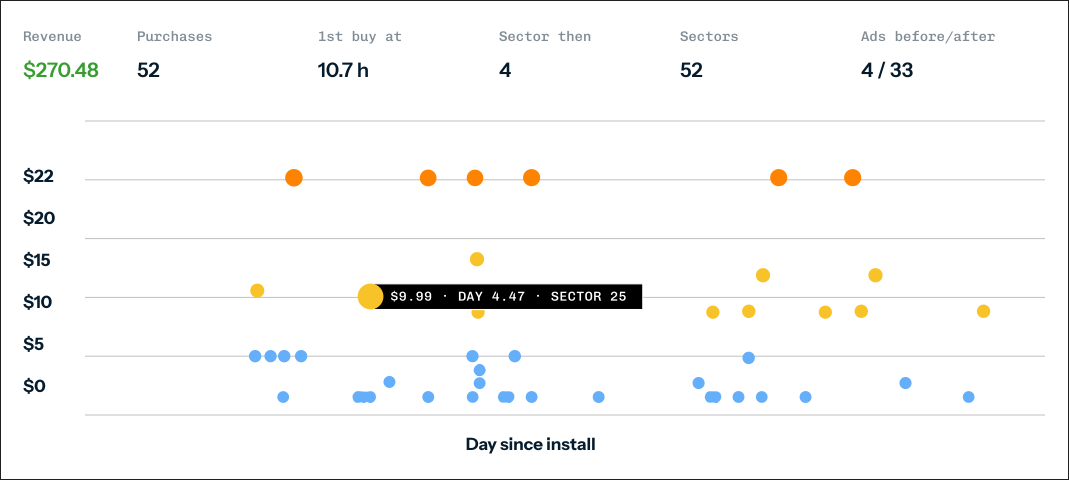
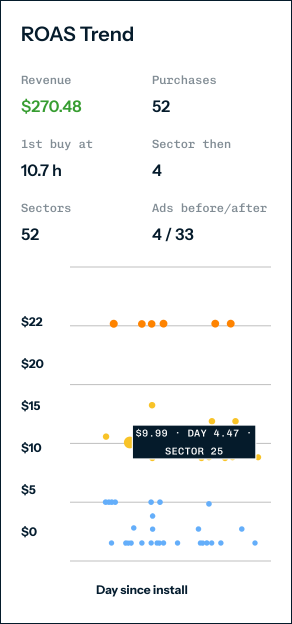
Here's the top repeat buyer in Cohort A — $270.48 across 52 purchases in 20 days.
Takeaway: IAP/DAU flat (~$0.195) both fortnights; DAU and IAP each ~51%. Revenue fell because traffic halved, not because paying got worse. (Spikes = bots; blended ratio otherwise stable.)
Turn a Question Into an Ongoing Analysis
Keewano can continue evaluating new events as they arrive and send the result upon a pre-defined condition to Slack or email, or trigger another system through a webhook.
Executive Summary
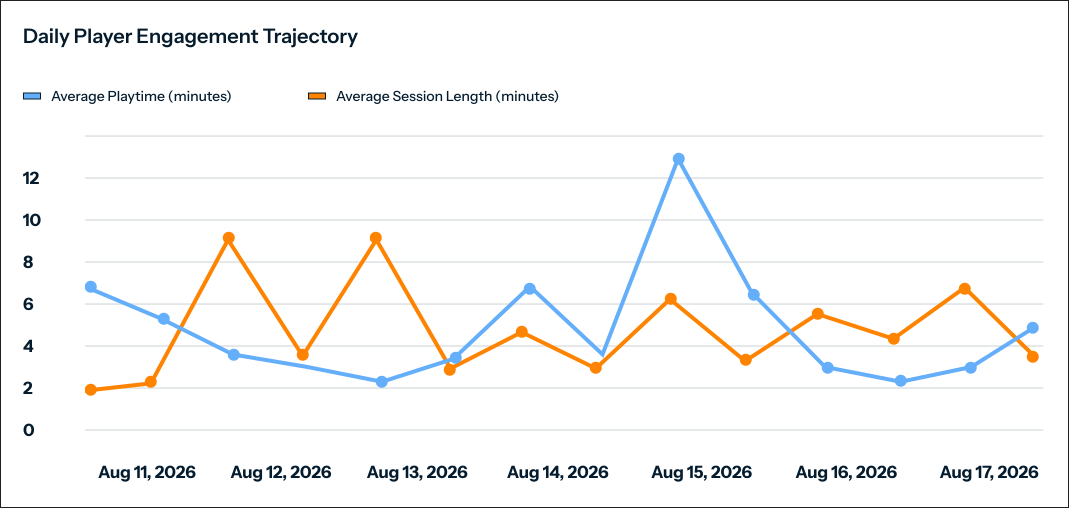
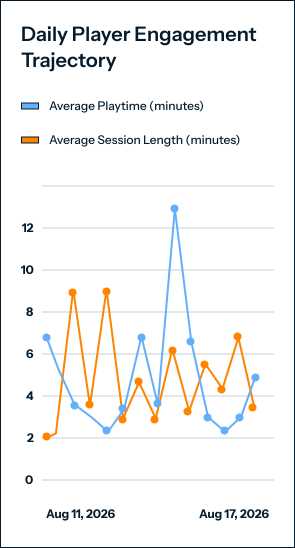
From August 11 to August 15, player engagement remained stable with daily playtime averaging 9 to 10 minutes and session lengths at 3.4 to 4.2 minutes, peaking on August 15. However, a sharp drop was observed on August 16, with playtime falling by 1.3 minutes (-12.75%) and session length dropping by nearly 3 minutes (-45.31%).
Here is the daily playtime and session length analysis for Realm Rush from August 11, 2026, to August 17, 2026. The data tracks daily engagement metrics and day-over-day variations to identify potential trends or sudden shifts in player activity.
Control How People and Agents Access Analytics
Control how people, services, and agents access analytics across teams, projects, and environments.
Keep the Tools Your Teams Already Use
Connect Keewano Analytics to the systems used by product, analytics, engineering, and AI teams.
Every interface works from the same underlying event record, reducing the need to maintain a separate analytics copy.
Analyze With Keewano Analytics
Ask new questions, compare patterns across millions of entities, and turn live event data into reports, charts, and ongoing checks without preparing dashboards, models, or pipelines.